Filed November 2, 2026
Averaging multiple in-season biomass passes into one rate zone map
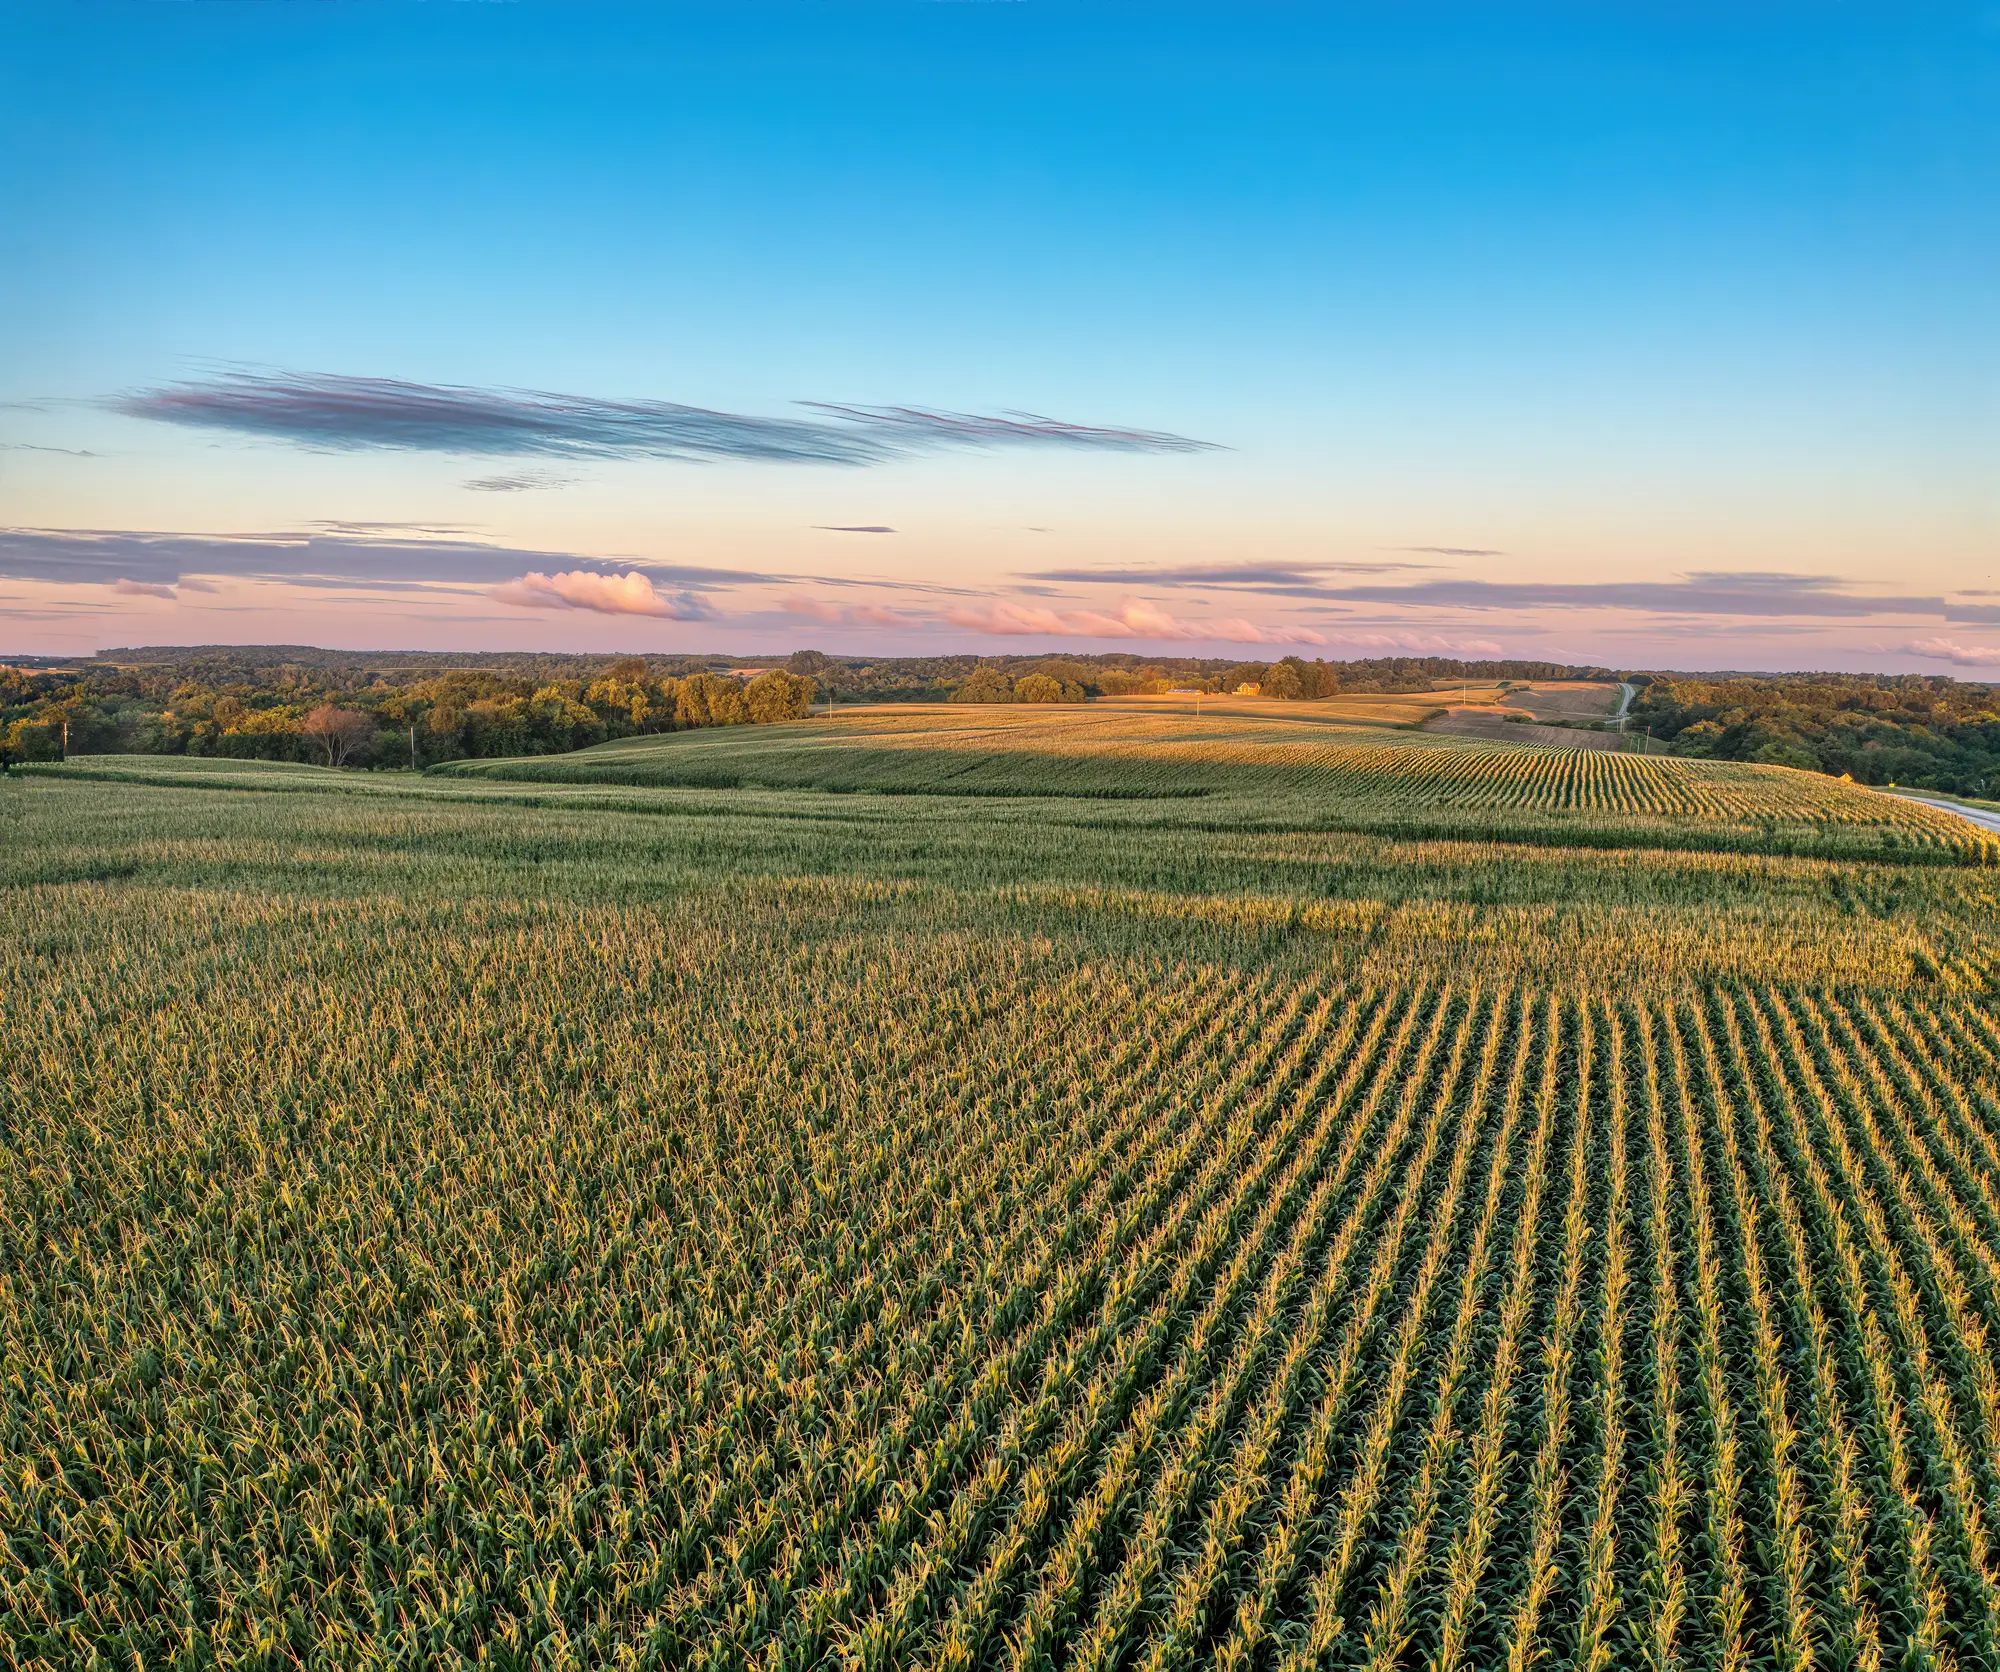
If you've pulled three or four biomass flights off the same field this season, you already know the problem: they don't agree with each other. The May pass shows a wet corner struggling; by June that same corner has caught up. By July the hot spot has moved to the sandy ridge on the east side. None of those passes is wrong, they're just snapshots of a field doing something different every two weeks. The question is how you turn four or five disagreeing maps into one zone layer a controller can run.
Why you can't just average the raw values
The instinct is to stack the NDVI rasters and hit average. Don't. A biomass index isn't on the same scale from one growth stage to the next, so averaging raw reflectance across a V4 pass and an R1 pass mixes two different measurements and calls it one number. A thin canopy in June and a closed canopy in July can produce similar index values for completely different agronomic reasons.
The fix most retailers settle on is to normalize each pass before you combine anything. Within a single flight, rank every zone relative to the rest of the field for that date, not against some fixed index threshold. That gives you a relative vigor class per pass, low, medium, high, same classes every time, regardless of what calendar date or growth stage produced the pass. Now you're comparing like to like.
Combining the passes into one zone map
Once each pass is classified on the same relative scale, you've got a few honest ways to merge them:
Majority class across passes. For each zone, look at what class it landed in most often across the season and use that as the final call. A corner that's been "low" in four out of five passes is a low zone, full stop, even if one flight caught it looking average.
Weighted average, biased toward later passes. Early-season vigor differences are often just emergence timing or a cold snap. By the time you're into reproductive stages, the pattern you're seeing is closer to what's driving yield potential. Weighting the later passes 2x or 3x against the early ones keeps a one-time planting hiccup from dragging a zone's whole-season rating down.
Drop the bad pass instead of forcing it in. Cloud shadow, a hailstorm scar, or a sprayer track running diagonal through a flight all count as noise, and the honest move is to pull that pass from the stack rather than let it skew the average. A multi-pass vigor map is only as good as its worst input if you include everything indiscriminately.
Whichever method you pick, smooth the result before you call it final. A single-pixel zinger in the middle of an otherwise clean zone almost always means equipment overlap, a turn row, or a sensor artifact, not a real agronomic boundary. Most retailers run a majority filter or a minimum mapping unit (an acre or two, depending on planter and sprayer width) so the final zone map doesn't ask the controller to flip rates every few feet.
Getting from zone map to rate script
The averaged, smoothed layer gives you three to five zones. That's the input, not the output. You still have to decide what seed population, N rate, or chemical rate goes in each class, and that call depends on soil type, yield history, and what you're trying to fix. A low-vigor zone on a sandy knob calls for a different fix than a low-vigor zone sitting in a wet draw, even if the imagery alone can't tell them apart.
This is the part that eats the most time when it's done by hand in GIS software: stacking five rasters, reclassifying each one, running zonal statistics, then exporting to a shapefile with rate columns the controller will read. A weekly imagery rate zone built this way, pulling the season's passes together automatically and handing you a zone file ready for seed, fertilizer, and chemical rates, is the workflow behind our in-season rate scripting setup. It's built for exactly this: combining passes for a prescription without redoing the GIS work every time a new flight comes in.
If you're tired of rebuilding this stack by hand every two weeks, see how Field Variability turns your weekly passes into a ready-to-load rate zone file.