To
The agronomy desk
From
Field Variability
Re

Stop drawing zones from last year's layers.

Field Variability reads the crop's vigor gradient every week of the season and writes it out as management zones and a rate file your controller can run. You keep the rate call.

Schematic of one field split into low, medium and high management zones 123
  1. 1Low zone, its own rate bump
  2. 2Medium zone, its own rate bump
  3. 3High zone, its own rate bump

Schematic only. Not a field we mapped.

GSD
Medium / 3–10 m
Cadence
Weekly in season
Imagery
Medium-res satellite
Spectral
Multispectral

01The job today

The zones were drawn in March

You build the script at your desk from what's on file: yield maps, the soil survey, EC, a sampling grid. Those zones go out and stay in place through the season.

Then the grower calls in June and says the north end doesn't look like the map. The crop on that end has moved on since the zones were set, and the sidedress script still treats it as the same ground. So you redraw by hand, or you fall back to a flat rate and hope the field averages out.
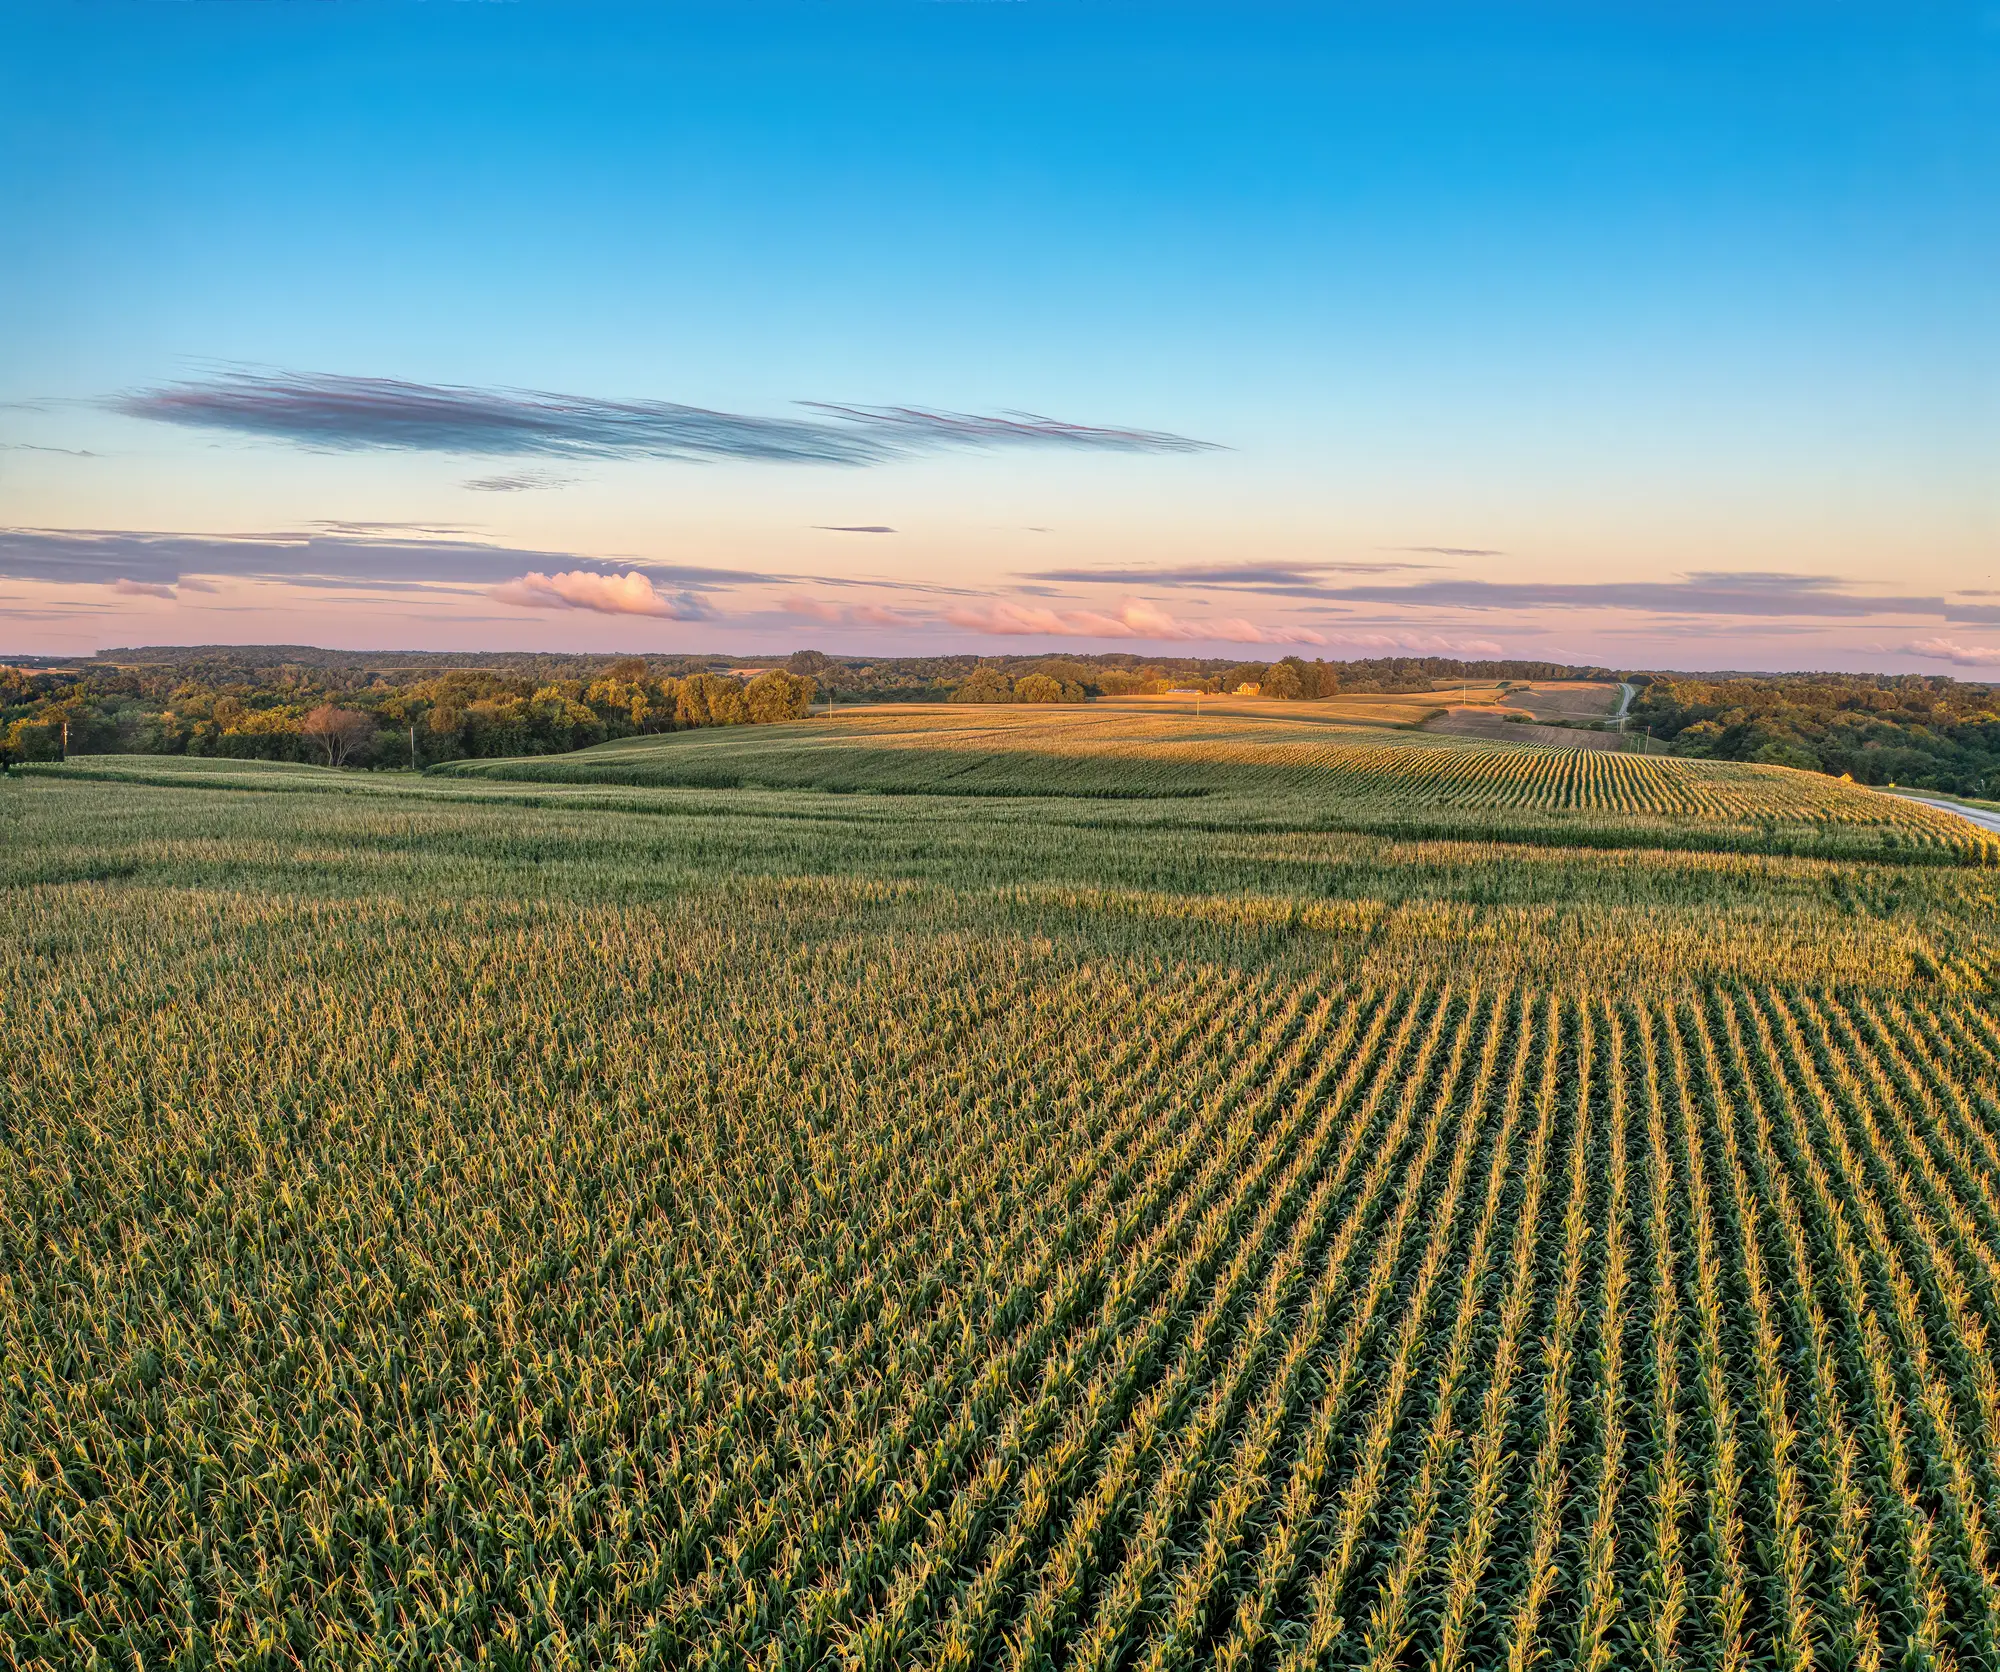
Rolling corn ground at sunrise, rows running up and over the rises

02Comparison

The same script, built two ways

RowStepZones drawn by handWith Field VariabilityStill yours
01Drawing the zonesYou draw them in your farm management software from yield history, soil layers and sampling results. They usually stay as drawn for the season.Zones come from this week's vigor and biomass read over each field boundary you send, so they follow what the crop is doing now.Yield history, soil tests and everything you know about the field. You decide what a zone means agronomically.
02Setting rates by zoneYou type a rate into each zone, product by product, or you run one flat rate.You tell us your base rate and the rate bump for low, medium and high zones. The file carries a rate for every zone.
03Getting it into the cabExport from your software, convert for the grower's controller, rename, send, and hope the terminal reads it.The prescription file is written for the controller format the grower runs, agreed per grower before the first pass.Loading it and checking it on the monitor before the machine moves.
04Talking to the growerA call built from a field walk and the last pass you looked at.A one-page memo each week: what changed since last week and which zones moved.
05Signing off the rateYou review the script and make the final call.You review the script and make the final call. The zone map and file are a draft to react to.The rate itself. Nothing here approves an application.

03What you get

What arrives each week

Files per field, once a week through the growing season, ready to sit beside what you already keep on each grower account.

  1. Encl. 1

    Zone mapShapefile

    Each field split into management zones from that week's vigor read. It backs the Drawing the zones row, and it opens in the GIS or farm software you already use.

    Ledger row 01

  2. Encl. 2

    Prescription fileController-ready file

    The rate script for seed, fertilizer and chemical, one rate per zone per product, exported in the format the grower's controller reads. It backs the rows on rates and the cab.

    Ledger rows 02, 03

  3. Encl. 3

    Weekly memoOne-page PDF

    What changed in vigor since last week and which zones moved. Written for your weekly grower call.

    Ledger row 04

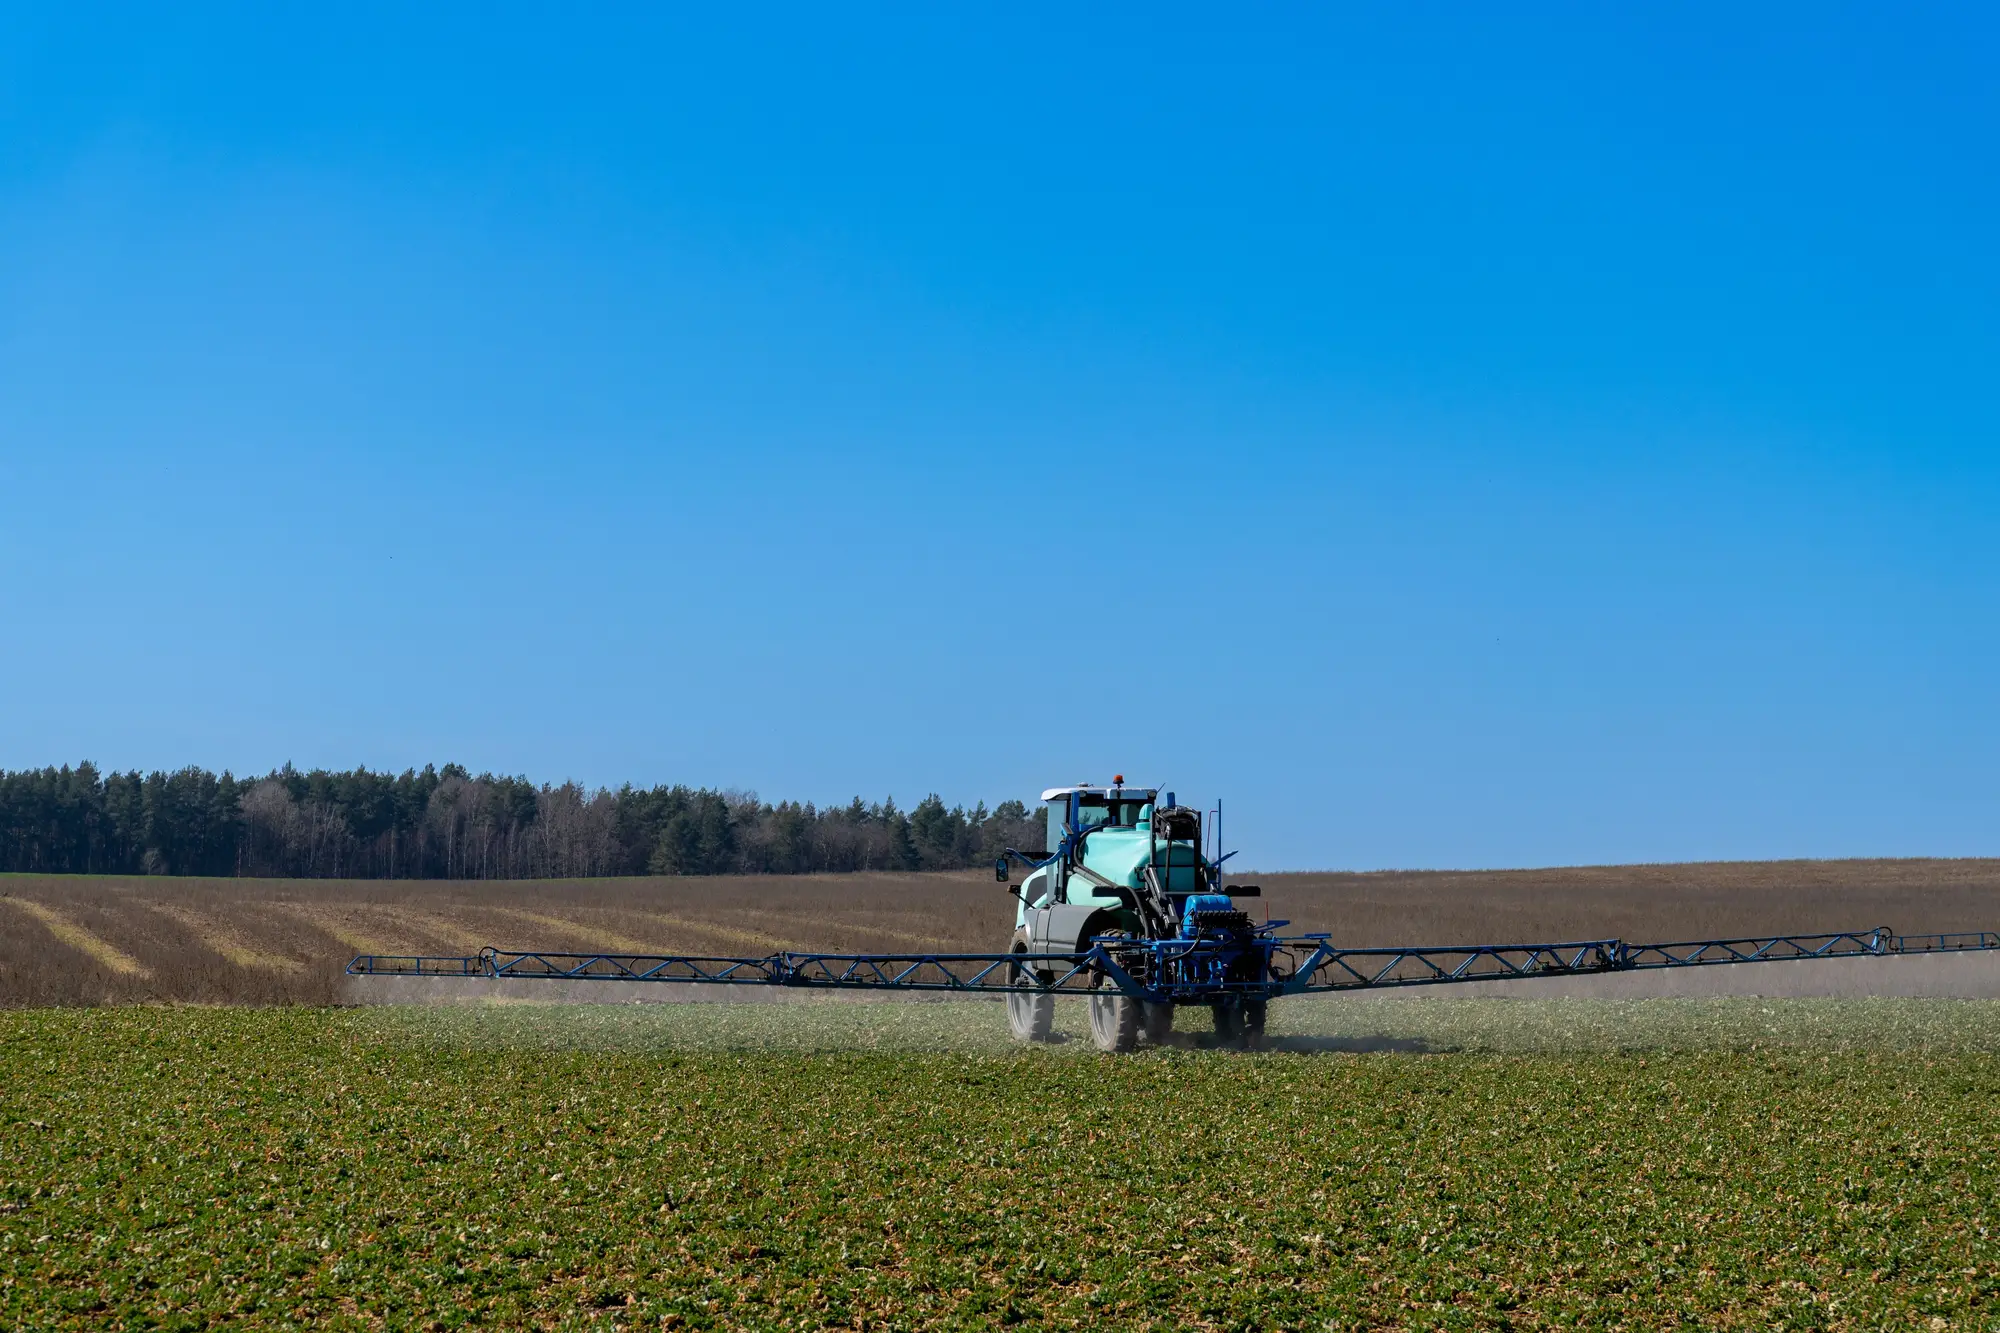
A self-propelled sprayer with its boom folded out, working across spring ground

04How it works

Through the season

You send the fields once. Zones and files come back each week.

  1. Before the first pass

    Send the fields

    Field boundaries for the grower account, plus the controller and format each grower runs.

    Set your rates

    Your base rate and rate bump per product. You stay in charge of them, and you can change them any week.

  2. Every week in season

    Weekly pass

    A medium-res multispectral pass over the fields, compared with the week before. The vigor and biomass gradient sets the zones.

    Files go out

    Zone map, prescription file and memo, each week of the season.

  3. After the season

    The run stops

    Weekly runs end with the growing season. There are no off-season reads.

05Limits

What the desk method still does better

Read these before you script a pass from the file.

  1. 5.1

    Small zones can merge

    At 3–10 m a pixel is large. Very small or irregular patches inside a field can fold into their neighbors, and the memo flags where that happened. Soil sampling and a walk of the field still find things a satellite pixel won't.

  2. 5.2

    Cloud can push a week back

    The imagery is optical. If cloud covers a field on every pass that week, that field waits for the next clear pass and the memo says so.

  3. 5.3

    In season only

    Runs are weekly during the growing season. This gives you nothing for off-season zone work such as post-harvest sampling or next year's plan.

  4. 5.4

    Vigor is not yield

    The zones follow how the crop looks. They don't predict yield, and we publish no yield-lift figure. The memo reports what changed, not an outcome.

  5. 5.5

    Controller formats are agreed per grower

    Format support is confirmed grower by grower and OEM by OEM. Don't assume a file loads in every cab out of the box.

06Who it's for

Switch if

  • You write variable-rate scripts for grower accounts at a retailer and want the zones to follow this week's crop.
  • You run flat rate on fields where you'd use zones if the setup took less time.

Stick with your desk method if

  • You need zones finer than a 3–10 m pixel can draw.
  • You want a tool that picks the rate. The agronomist signs off on the final rate.
  • You need an off-season zone layer built from yield and soil data.

07FAQ

Before you switch

Does this replace our farm management software?

No. You keep the software for records, boundaries and as-applied maps. The zone map and prescription file come in from outside and load into it.

How do we check the zones against what we know?

Put them next to your own yield maps, soil tests and what the grower sees in the field. If a zone looks wrong, send it back and we'll go through that week's imagery with you.

Which controllers does it export to?

It depends on the grower's controller and OEM. We confirm the format with each grower before the first file goes out, and we don't claim universal support.

What happens under cloud?

That week's read waits for the next clear pass, and the memo tells you which fields it applies to.

What resolution is this?

3–10 m per pixel. That follows gradients across a field. Tiny or irregular patches can merge into their neighbors.

Is there a yield-lift number?

No. The memo reports what changed in vigor. It makes no promise about outcome.

How often does it run, and when?

Weekly during the growing season. There are no off-season reads.

Who owns the files and the imagery?

Your boundaries and rates stay yours. The licence on the imagery behind the maps and how you may share the files get written into the project agreement before the first week.

How is it priced?

We quote a project after we've seen the fields. There's no price list on this page.

Reply slip

Send us one grower's fields before the first pass.

Send the boundaries and tell us the controller. We'll scope the weekly zone run from there.

Start a project